Handmade Penguin Chapter 0: Getting Started
This chapter is still under construction. Hopefully the bits that are here are
useful, but if you hit refresh or visit it later it might have changed!
This chapter covers roughly the content in the
Into to C on Windows part
of the Handmade Hero course under the Linux operating system. You can find more
information if you go: Back to Index
C on Linux
First, a warning: I'm not going to be teaching C, or even how to use C on Linux in any detail, but
this is the setup I'll be using, so you know how to follow along.
To start, we need to install a compiler, on a Debian-based distro, we
can install a C++ compiler with:
apt-get install build-essential g++ libc6-dbg
The build-essential contains packages that are needed to build software,
and g++ is the GNU C++ Compiler. The package libc6-dbg includes debug
symbols for the standard library. If you have an irrational hatred of g++,
clang is pretty great, too.
Once you're done, you'll be able to compile a C++ program with:
c++ -g -o test test.cpp
where c++ is a link to the system C++ compiler (replace it with g++ or clang++
if you don't approve of the system's choice), -g says we want to compile with debugging information,
-o test says we want to output a file named test and test.cpp is the file we want to compile.
You'll also need to install a debugger:
apt-get install gdb
While gdb is the standard Linux debugger, it can be a real pain to use: it runs from the command line
only, and involves typing arcane commands in. Using gdb is a useful skill, but we'll cheat a bit by
using an IDE (Integrated Development Environment).
KDevelop: An IDE
There are more C++ IDEs for Linux than one can poke a modestly-sized stick at: from Anjuta to Qt Creator, they
all have inventive names and a serious case of Visual-Studio envy. While it's certinaly possible to program
on Linux without an IDE (indeed, it's quite popular: with text editors like emacs and vim, Linux has
a long history of writing code in a general purpose editor), but debugging is another story.
To make things easier, I'm going to unilaterially declare that I'm going to use KDevelop.
KDevelop is a pretty nice IDE: it has good debugging support, some really nice features for navigating and writing C and C++
code. The biggest downside to it, is that on some machines it's a little bit crashy, so save your work often!
We can install KDevelop the usual way:
apt-get install kdevelop cmake
You may notice that I'm also installing cmake. CMake is a build system
(or technically, a meta-build system, which is a terrifying thought) which lets us write big projects with
more than one source file and not need to worry about exactly when we need to recompile each bit of it. It's also the system
KDevelop uses to manage projects so it's important to install.
When you start KDevelop, you should see a screen like:
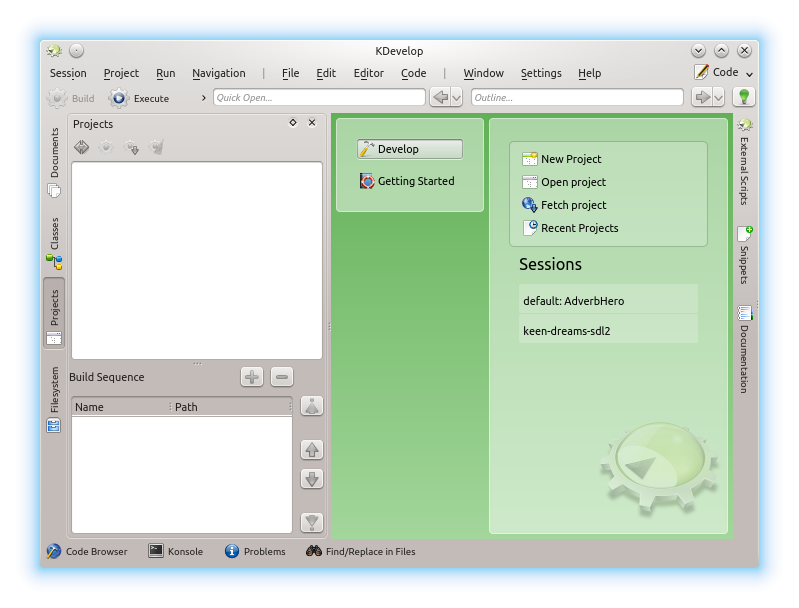
You'll want to click on New Project and then select a
Standard -> Terminal project. Unlike with Windows,
all programs on Linux have access to the terminal, so there isn't the same
distinction between Console and Windows applications. Give it a name
(I'll use "test") and continue. You won't need a version control system,
so leave it as None.
Once you've finished the project creation wizard, you'll get this terrifying
screen:
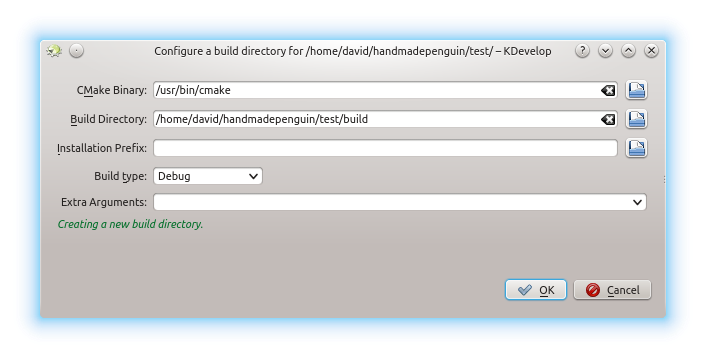
This tells KDevelop how you want your code to be compiled. All ofthe default options
will probably be okay, but let's have a quick look through them.
- CMake Binary: This is the location CMake was installed to. It's almost always /usr/bin/cmake.
- Build Directory: This is the directory you want your compiled program (and all of the compiler's temporary files)
to go. By default it's a build/ directory within the code directory, which is fine for now.
- Installation Prefix: This is the path you want your program to be installed to. We won't use CMake's install feature, so let's leave this blank.
- Build type: Selects the type of build you want: while you're still developing, this should be Debug. When you're ready to release, you can try the others, which optimize the code more and sometimes leave out Debug info.
- Extra Arugments: If you have any other options you want to give CMake, you can pass them in here.
Let's just click OK and look at our new project.
Let's get coding!
You should now have a screen that looks something like this:
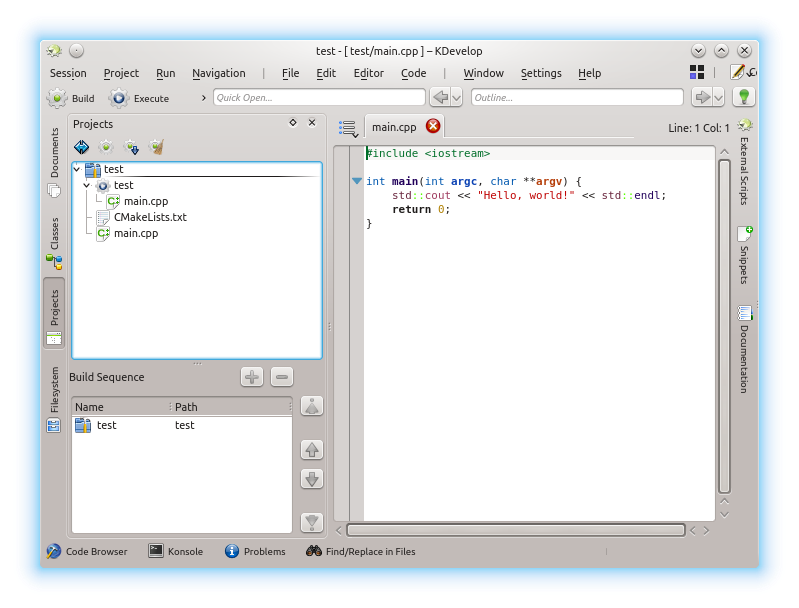
To the left you can see the Projects display. This shows all of the files in your project (it does show some of them twice,
as the icon with the "gear" is a container for files which are acutally being compiled). You can toggle it on or off by clicking on the word "Projects" which will be rotated 90ô at the far left of the screen. If it doesn't appear, you right-click on the bar at the edge of the screen to add it.
You'll notice that KDevelop generated a bunch of code for us. That's really nice of it, but
we want to write our own, particularly since it's using some yucky (technical term) C++ features like iostreams.
Before we delete the sample code,
it does point out something useful: unlike the Windows application in the Intro to C stream, we're using the main
function, not the WinMain function. Much like code using the Console subsystem mentioned in one of the Q&A sessions,
Linux programs always start with a standard main function, which takes two arguments:
- argc: The argument count, which is the number of command-line arguments, an integer.
- argv: The argument values, which is an array of strings (which are arrays of characters) representing each of these command-line arguments.
So, let's get started. Delete all of that code, and type something random into the file (I typed jellyfish).
Now hit the Build button in the top left. The build configuration window will pop up again, because it's annoying,
but just hit OK: it won't bother us again after that. You should see a bunch of scary looking text appear in the "Build" panel
at the bottom of the screen:
/home/david/handmadepenguin/test/build> make -j2
Scanning dependencies of target test
[100%] Building CXX object CMakeFiles/test.dir/main.cpp.o
/home/david/handmadepenguin/test/main.cpp:1:1: error: 'jellyfish' does not name a type
 jellyfish
 ^
CMakeFiles/test.dir/build.make:54: recipe for target 'CMakeFiles/test.dir/main.cpp.o' failed
CMakeFiles/Makefile2:60: recipe for target 'CMakeFiles/test.dir/all' failed
Makefile:113: recipe for target 'all' failed
make[2]: *** [CMakeFiles/test.dir/main.cpp.o] Error 1
make[1]: *** [CMakeFiles/test.dir/all] Error 2
make: *** [all] Error 2
*** Failure: Exit code 2 ***
This is the compiler warning me that what I just typed wasn't valid code. The important line is the one:
/home/david/handmadepenguin/test/main.cpp:1:1: error: 'jellyfish' does not name a type
This says that, in the file /home/david/handmadepenguin/test/main.cpp in line 1, column 1, there was a
compile error. The exact error here is not too important, as what we entered wasn't correct code anyway (the compiler thinks
jellyfish is a variable, and is wondering what type it should be), but that's the form an error message takes.
What if we get rid of jellyfish and write some actual code?
void foo()
{
}
If we now hit build, we get another error:
/build/buildd/glibc-2.19/csu/../sysdeps/x86_64/start.S:118: undefined reference to `main'
This is a linker error, telling us that part of the C runtime library (glibc) is complaining that it can't
find your main function. Let's oblige it — add this to the bottom of the file.
int main(int argc, char *argv[])
{
	foo();
}
If we build it now, everything should work: we'll get a nice green message in our build window:
[100%] Built target test
Success! Our program compiled correctly!
So, what if we want to run our program. Let's hit the Execute button next to
Build.
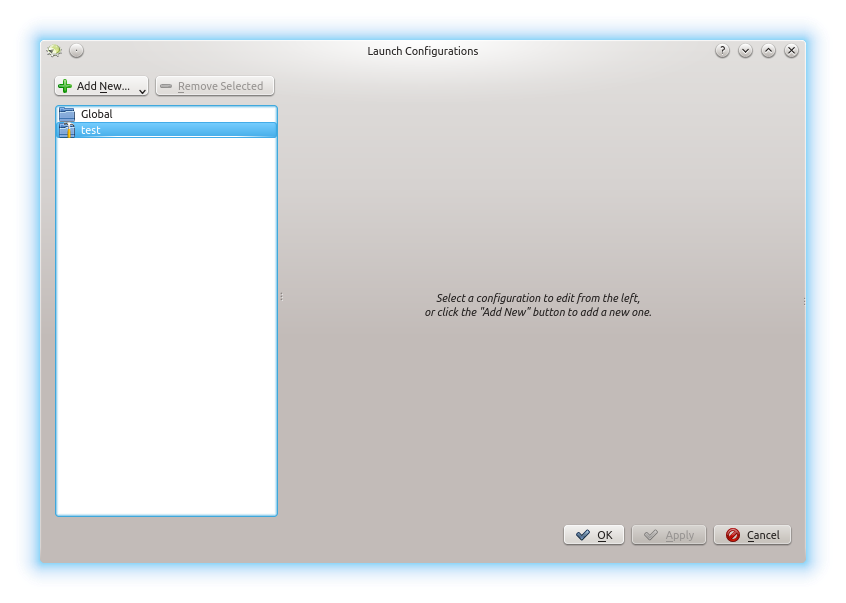
Oh no! KDevelop doesn't know what program we want to run. (It would be too much to expect it
to run the program we just compiled, of course.) Click on the Add New... menu and select
test, which is our program. You'll get a bunch of options for our new launch configuration
show up:
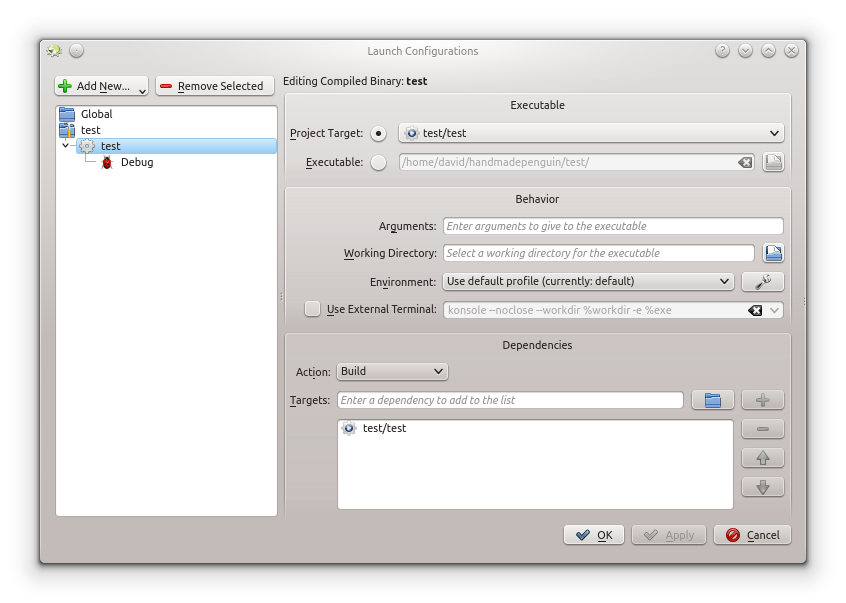
All of the options here are fine, and they're also all pretty self-explanatory, so let's just click OK for
now. We can always get back to it later in the Run -> Configure Launches menu.
You should see something like:
Starting: /home/david/handmadepenguin/test/build/test
*** Exited normally ***
in the Run panel at the bottom of the screen.
Note:Some recent versions of KDevelop seem to have a bug (figures) that breaks the "target" option
in Launch Configurations, leading to a nice error like:
Starting: /test
*** Could not start program '/test'. Make sure that the path is specified correctly ***
If you get this error, go back into Configure Launches, change "Project Target" or "Executable" and enter the path to the
compiled executable (/home/david/handmadepenguin/test/build/test on my machine). You can click on the little folder
icon to get a file browser. Hit OK and everything should now work. Isn't technology grand?!
|
To make things more interesting, let's output some text. Unlike in Windows, we don't have an OutputDebugString
function. The standard way to output debug messages is to use the printf function in <stdio.h>
(Technically, there are two standard outputs on Linux, stdout (standard output) and stderr (standard error). printf writes to stdout.)
First we'll need to include stdio.h. Add this to the start of the file:
#include <stdio.h>
Now, add the following line inside the curly braces of the foo() function:
printf("This is the first thing we have actually printed.\n");
Compile and run. You should see our new line in the Run window!
Aside: CMakeLists.txt
You may have noticed this strange file in your project: CMakeLists.txt.
This is the file that tells CMake (and KDevelop) what files are in the project and
how they are to be compiled together.
If you add a new file to the project (right click on the "gear" icon for your project and click "Create File")
it gets added to this CMakeLists.txt file, and when you Build your project, this file is used to work
out what options to pass to the compiler.
Let's have a quick look at what KDevelop has put in our CMakeLists.txt file for us:
cmake_minimum_required(VERSION 2.6)
project(test)

add_executable(test main.cpp)

install(TARGETS test RUNTIME DESTINATION bin)
This is fairly straightforward, so let's look at it line-by-line:
cmake_minimum_required(VERSION 2.6)
This simply means that the CMakeLists.txt file requires at least CMake version 2.6.
project(test)
The following commands are for a project named test.
add_executable(test main.cpp)
The project should create an executable called test made by compiling the file(s) main.cpp.
install(TARGETS test RUNTIME DESTINATION bin)
This tells CMake that if you want to install your program, the file test (our executable) should go in the bin
directory. We won't be using CMake's install feature, so this doesn't really matter for us.
If you want to compile your program without using KDevelop, you can run CMake directly from the command line.
Simply cd into the directory you want to put the final compiled program, and type
cmake path-to-source-code
where path-to-source-code is the path to the directory containing the CMakeLists.txt file.
This will generate some Makefiles which contain the exact instructions to the compiler. You can then type
make
to compile your program.
Debugging
Much like in Visual Studio, you can use KDevelop as a debugger. While, under the hood, KDevelop uses gdb, it provides
a much nicer (and more familiar) interface on top.
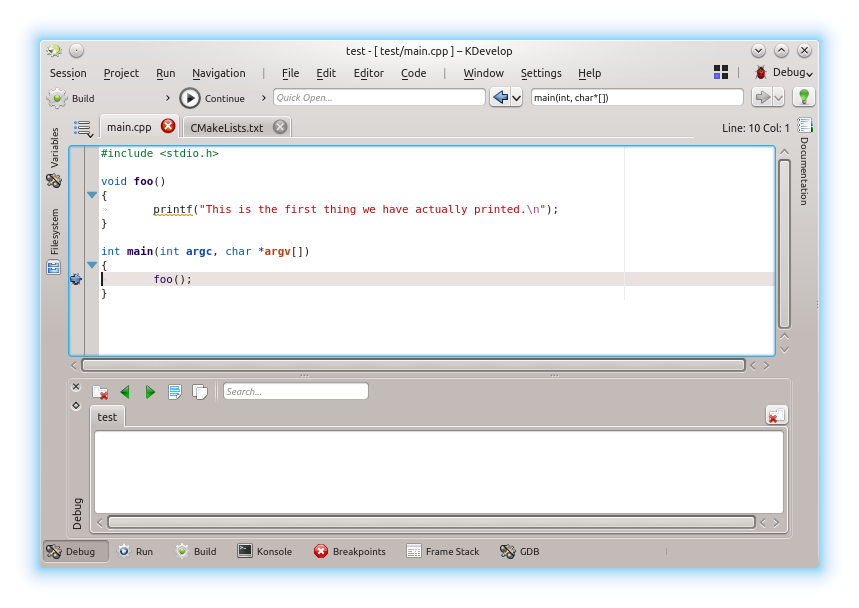
Let's start by putting a breakpoint at the start of our main function. Find the first line of main (after the opening brace)
and click in the column on the left of the code window. (This is the column to the immediate left of the one with all of those
blue arrows that face down. Those arrows are there so that you can hide the contents of functions if you don't want them to distract you. If you accidentally click on one and your code disappears, just click on it again and it'll come back.)
Once you've clicked in that column, a little ladybug will appear and that line will turn a faint pink/red colour. This means that
you've successfully inserted a breakpoint on that line, and the debugger will stop your program when it hits that line.
To actually debug our code, we need to click on the Debug button, which is to the right of Execute by default.
When we do that, you'll notice that KDevelop switches to the Debug Area and our Project tool from the side of the screen
disappears. (If you miss it, you can put it back by right clicjing on the bar where it was, or you can switch back into the default
code view with the area button in the top right of the window.)
You'll notice that there is a blue arrow over the top of the ladybug on the line we made a breakpoint. This is the line that is
about to be run. You should also notice three buttons in the toolbar at the top of the screen (unfortunately you can't see them
in the picture, they got cut off to the right of "Continue"). These are "Step Over", "Step Into" and "Step Out", and are your tools
for moving around when you're debugging.
As we want to see something happen, let's Step Into the foo() function by clicking on Step Into or pressing
F11. This will move the next line to be executed into the function foo().
If we click on the "Frame Stack" button at the bottom of the screen (you might need to right click at the bottom of the window and enable it), you should be able to see where we are:
#0 foo() at /home/david/handmadepenguin/test/main.cpp:5
#1 main() at /home/david/handmadepenguin/test/main.cpp:10
This tells us that we're inside the function foo() on line 5 of main.cpp, which was
called from main() on line 10 of main.cpp.
Now let's run the printf call. We don't want to step into it (we don't have the source code to printf lying around
to debug into, sadly. It's possible to install it, but it's much, much harder than open-source should make it.), so let's Step Over it by clicking on the obvious button or pressing F10. If you accidentally step into it, you can get back out with
Step Out(F12). These and other similar options are in the Run menu.
If we click back on Debug at the bottom of the screen, we can now see the line "This is the first thing we have actually printed."
This tells us that the printf() line must have finished executing. We can now tell the debugger to finish running the program.
To do this, we press Continue which will keep running until the program hits another breakpoint. Since there are no more breakpoints, this will keep running until the program exists, and KDevelop will return to the Code area.
Variables and the Watch Window
Let's add a variable to our main() function so we can look at how the Watch window works in KDevelop.
To the beginning of your main() function, add something like this (from Day 2):
int Integer;

Integer = 5;
Integer = 5 + 2;
Integer = Integer + 7;
Now re-compile, and move the breakpoint from the call to foo() to the first line of main(). You can remove a breakpoint by clicking on the ladybug it left behind. Then just click in the column next to int Integer; to create a new one.
Start debugging again. The code will stop on the breakpoint. You can now inspect your program while it's in this state.
Let's mouse-over Integer. You should see a little popup saying: "name: Integer, value: 0, type: int". This tells you
that the current value of Integer is 0. This is purely by chance: we haven't set Integer to anything yet, so
it has the random value of whatever was in that bit of memory, which was probably (but not definitely) zero. Unlike Visual Studio,
g++ doesn't automatically clear things to 0xCC in debug mode.
If you look to the left of the screen where the Project tool was, you should see a Variables tool you can open.
(Again, if not, right click on the edge of the window and add it from the menu.) This is the equivalent of the Watch window
in Visual Studio. Click on it to open it up.
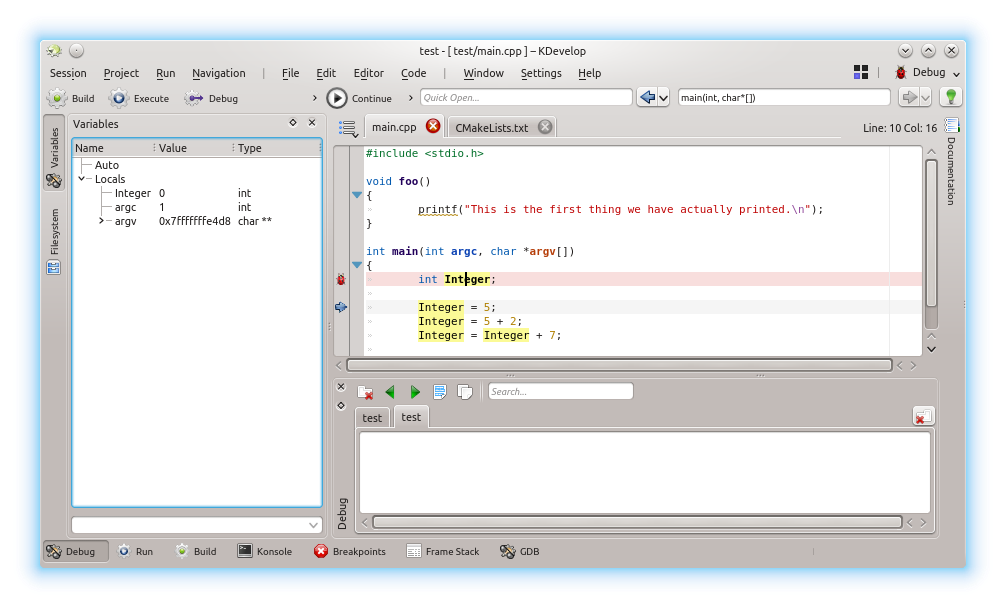
If you look in the Locals section, you can see the values of all of the local variables. You can also watch a specific
variable by entering its name in the textbox at the bottom and hitting Enter. It will then appear in the Auto section.
Press Step Into or Step Over (as the next line doesn't call a function, they do the same thing). Notice how
the value of Integer in the Variables tool has changed to 5. Keep stepping through the program and look at how the variables change.
End of Lesson!
You've reached the in-progress point of this chapter. I'll likely add a few other things (how to use the Memory window, for example), but this is a great start!
You now should be ready to start Chapter 1.